
The physiological processes involved in the growth process of mussels are explained by the energy balance equation where growth is the difference between energy absorbed (absorption) and energy used (metabolic rate). Feeding behavior of mussels is influenced by the variation in quantity and quality of the food (plankton, organic matter and minerals) available.
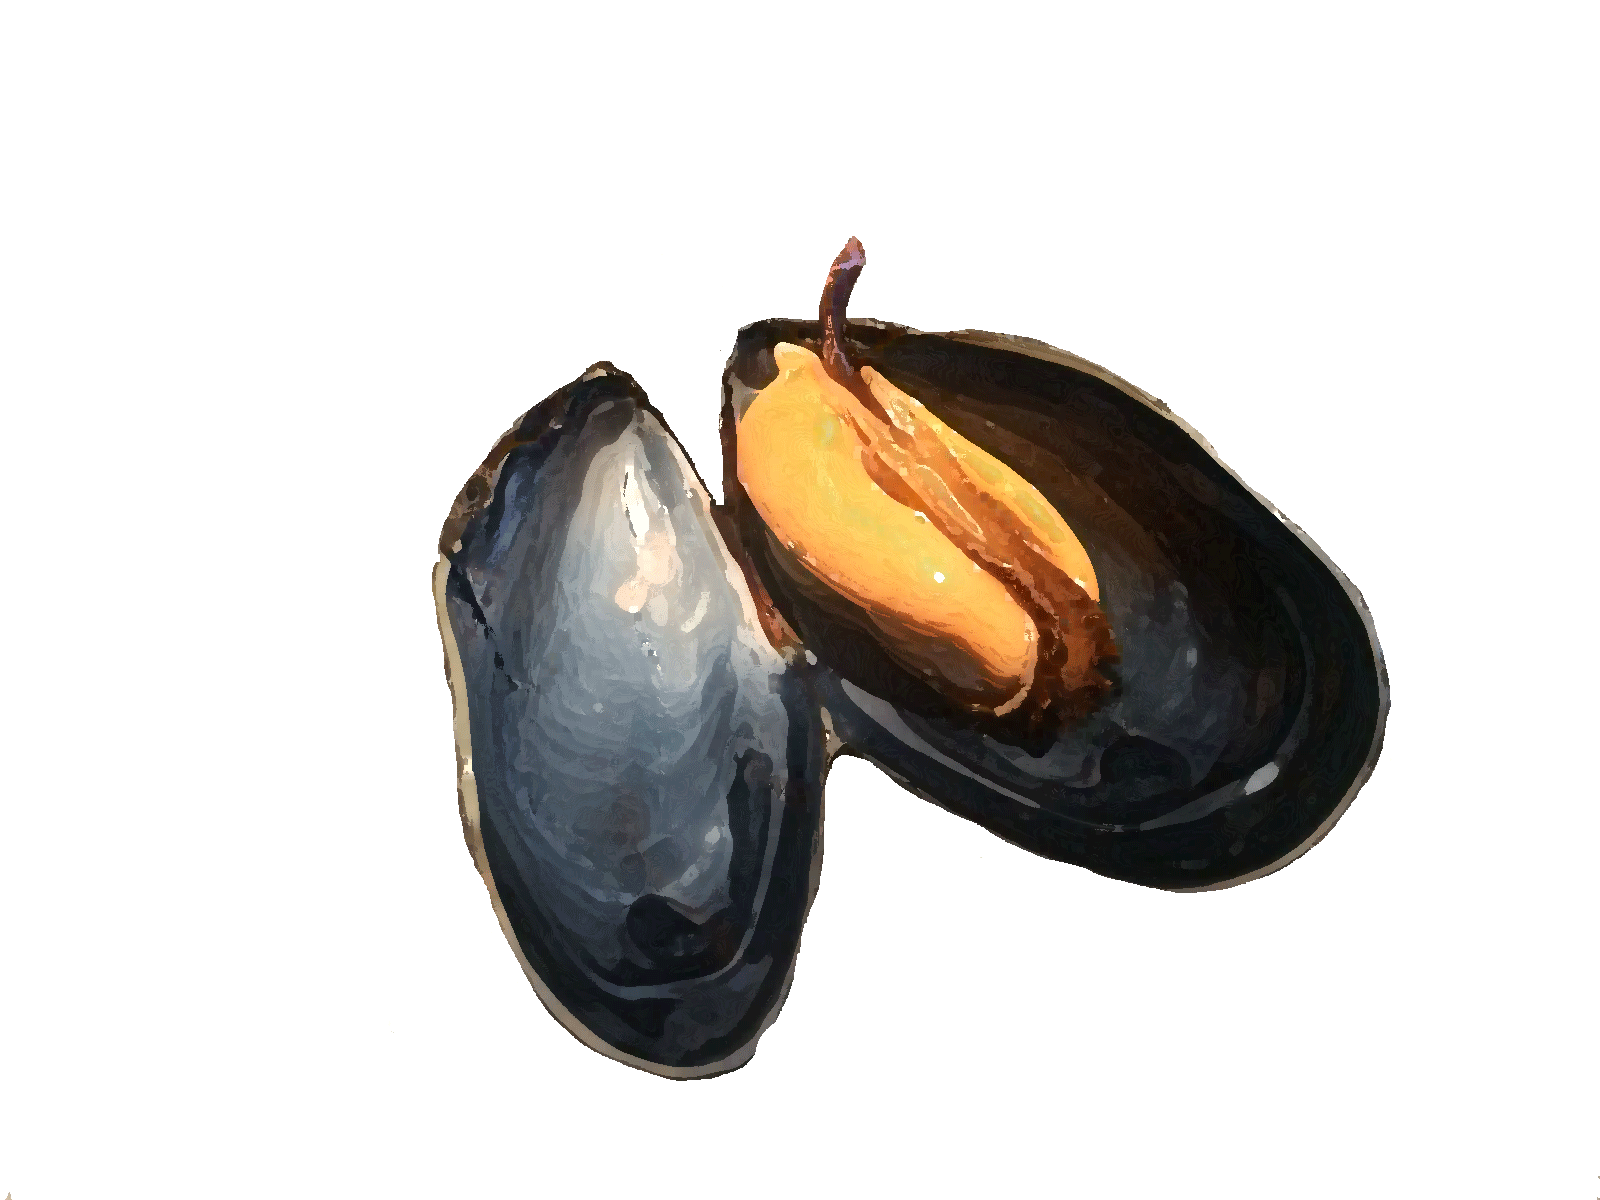
Mussels are filter-feeders that filter the surrounding water and select food for ingestion. The eco-physiological processes of food uptake (Figure 1) can be summarized in the following processes: flow of water through the mantle cavity; retention of particles on the gills; particle sorting (with the unassimilated material being returned to the water column as pseudofeces); uptake of particles in the gut (with feces being material that is shed before nutrients are absorbed); and nutrient uptake. These processes allow mussels to sort and absorb food from the water.

Fig.1 Particle digestion in the blue mussel (Willer & Aldridge, 2017)
To gain more insight into why mussel growth differs between different locations in the Wadden Sea, 9 measurement campaigns were conducted at two aquaculture sites in the Wadden Sea. During these measurement campaigns, the feeding behavior of mussels under different natural food supply was studied more closely.
At the different sites, the filtration rate of mussels was measured using the “Clearance Rate” method (which measures the decrease of particles after filtering by the mussel). The CR setup (Figure 2) consisted of 30 individual chambers designed for optimal water flow. Unfiltered seawater from the site was continuously pumped from 1 m above the mussel plots to a collection tank and was further distributed to the chambers from there. Twenty-five mussels were individually placed in the chambers and acclimated for one hour. Five of the 30 rooms did not contain clams (control rooms). After the acclimatization period, water samples were taken several times a day simultaneously from the exit of the 30 chambers where the flow and particle concentrations were measured using a particle counter (PAMAS).
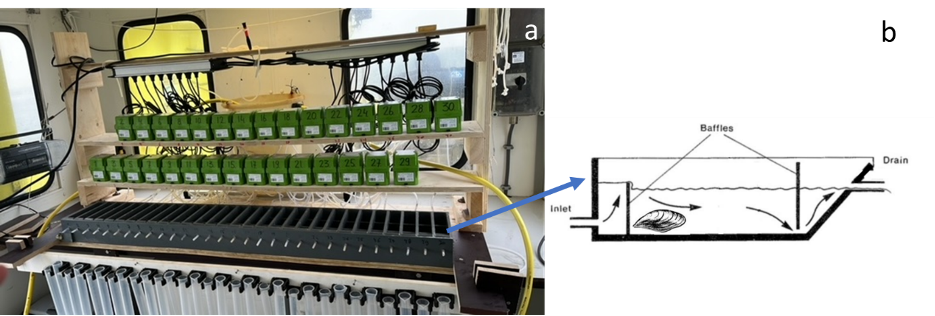
Fig. 2 (a) Overview of the setup used to measure the filtration rate of mussels; (b) drawing of one of the rooms
At the same time, we also measured how much of the ingested particles was excreted by the mussels as pseudofaeces or as faeces . This “biodeposition” method is used to estimate which food is captured, ejected, taken up and absorbed. Chambers of the same design as those used for CR measurements were used, but the dimensions of these chambers were larger to make the collection of feces and pseudofeces easier. The biodeposition setup received water from the same collection tank as the CR chambers, and the water flow rate in the chambers was set at the same rate as the flow rate in the CR chambers. Mussels were individually placed in the chambers and acclimated for 1 hour. After this period, all the material was removed from the rooms. During a 30-minute period, the feces and pseudofeces of individual mussels were collected separately.

Fig 3 (a) overview of the biodeposition setup with a close-up (b) of a mussel where faeces and pseudofaeces can be seen.
The results show that the mussels at Oosterom were better able to capture smaller particles (smaller than 5 µm) than the mussels at Slenk. Mussels in Slenk found higher retention efficiencies for particles above 10 µm (Figure 4). The fact that mussels are able to retain smaller particles more efficiently may play an important role in their feeding, and before that in their growth, since particles of this size make up an important fraction of the total organic particles in the water column (Figure 5).
The large amount of particles in the water at Slenk (thick water) could have a negative impact on the retention efficiency of mussels. This shift from retention to larger particles is likely a mechanism of mussels to reduce their food intake rate to avoid exceeding their intake capacity.

Fig 4. Retention efficiency of mussels for the different size classes of particles found in the seston at the two studied sites over the different months of the year.
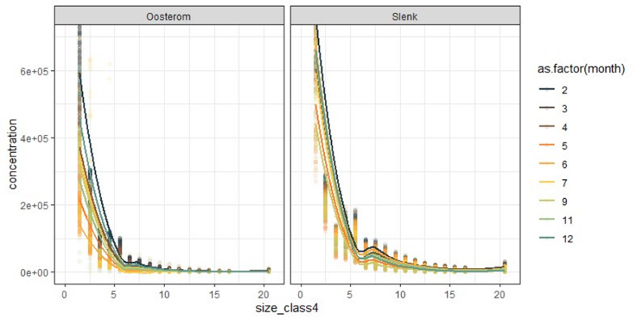
Fig 5. Number of particles (per ml) per size class measured at the two sites during the 9 measurement campaigns
According to most shellfish filtration rate studies, a decrease in filtration rate is found at high seston concentrations. However, most of these studies have been conducted under laboratory conditions where the selected food consists of only a few algal species. During our field study, high filtration rates (Figure 6a) were found at both sites, with the highest filtration rates in March, when spring algal blooms occur. Notable are the high filtration rates measured during this study at Slenk, the location with the most particles in the water (see Figure 6b). In contrast to laboratory studies, the the suspended material in the water column consists not only phytoplankton, but also a considerable amount of detritus and inorganic material (such as sand and silt). Of the particles in the water at Slenk, only a small proportion are organic (Figure 6b). It seems that the mussels in Slenk have to filter more water to get enough food so they spend more energy on filtering and selection at the expense of growth. So the clams have to work harder when the water is “thick.


Fig. 6 (a) Monthly filtration rates by particle size class in the water column (up to 25 µm) for the two sites; (b) Concentrations of suspended solids and organic matter in Oosterom and Slenk during the months studied.
The biodeposition measurements show that the production of pseudofeces increases with the concentration of inorganic particles in the water. However, pseudofaeces consist not only of inorganic material, such as silt, but also an excess of (undigested) phytoplankton cells or organic material. The method of sorting, ingesting and having to dispose of material as pseudofeces places another burden on the growth of the mussel.

Fig. 7 Feces and pseudofeces production at Oosterom and Slenk collected by the biodeposition method
Figure 8 summarizes the results. The figure shows that the number of particles in the water is much higher at Oosterom than at Slenk. Filtration increases as the number of particles increases. Pseudofaeces production (Rejection Rate) is higher at Slenk than at Oosterom. Since the higher activity of mussels at Slenk does not translate into higher growth , the physiological cost to the mussels is so great that it comes at the expense of growth, despite the higher amount of algae and organic matter in the water at Slenk.

Fig. 8 Filtration and production of pseudofaeces (Rejection Rate) in mussels at the two sites studied expressed relative to the number of particles in the water.