

Determining the critical threshold for runoff (CDT), such as by flow, helps identify vulnerable areas to make management decisions. CTD can vary considerably. In mussel plots, some individuals or groups of mussels may be less sensitive to disturbances because of their adaptation to the environment. Moreover, differences in composition and topography of the soil and how mussels organize on it can lead to large local differences in sensitivity to disturbance. This means that the CDT can vary within a mussel plot. Previous studies have also shown that mussel beds in different areas with similar disturbances can vary greatly in their response. This may be due to local conditions. Although not yet well proven, the correlation between CDT and how the area is may help reduce the difficult work of measuring CDT on a spot-by-spot basis. This would allow a more precise assessment of risk.
In this research, we studied the behavior of mussel clusters in the Wadden Sea under the influence of currents, using accelerometers and wave loggers (Figure 1b). This field campaign took place simultaneously on eight different mussel culture plots (Figure 1a), with seven accelerometers and a wave logger at each site. The monitoring period ran for about five months, from December 2022 to April 2023. Of the 56 accelerometers placed, 40 were successfully recovered, while all eight wave loggers were recovered undamaged. Each plot therefore had at least three accelerometers coupled to a wave logger to determine the specific CDT for that location.
Fig. 9(a) Geographic distribution of the locations where accelerometers and wave loggers were deployed. (b) Arrangement diagram of the frame used to place the accelerometers and wave loggers at each location.
Prior to the field survey, we conducted calibration tests in the NIOZ stream channel to better identify the runaway threshold of mussels from accelerometer data. Mussel clusters with accelerometers were deposited in the stream channel on a replicated mussel bank and allowed to clump together under gentle waves for 3 days. During this period, mussel clusters attached themselves to surrounding mussels and formed a homogeneous labyrinth pattern. Strong waves were then introduced to wash the clusters of mussels loose. This calibration test was repeated five times with different clusters of mussels. Based on the average motion intensity recorded by the accelerometers during the tests, we could clearly distinguish between stable and washed away (Figure 2).

Fig. 2 Results of the accelerometer calibration test performed in the NIOZ flume. This allows clear identification of the stability and moment at which the clams wash away.

Fig. 3. The response of mussels to soil shear stress (gray dots) and the probability of mussel clumps washing away under different soil shear stress velocities (blue open dots) in each plot where measured. Critical thresholds for road wash (CDT) were derived using logistic regression on the transformed data (blue lines).
Using the test in the flume, we were able to convert the collected field data on mussel movement to a simple “yes” or “no” signal and link it to the bottom shear stress: the rate of movement near the bottom (Figure 3). A value of 0 indicated that the clams were stable, while 1 indicated that they had become dislodged. The CDT, which represents the rate at which there is a 50% chance of mussels detaching, was calculated using these data (Figure 3). As expected, results showed that mussel beds with different locations had varying CDT values ranging from 0.2 m/s to 0.4 m/s.
By looking at how mussels respond to movement in specific locations, we found that the depth of the water and the force of the water are important (Figure 4). These two things are connected: when the water is deeper, the power of the water is stronger. We found that the depth of the water and the strength of the water affect how easily mussels are released.
Since the depth of the water and the strength of the water are related, we finally decided that the depth of the water is a good way to predict how easily mussels can be released in different places. We created a mathematical formula that helps us predict what might happen in different places in the sea. We use maps with information about the depth of the water for this purpose.
This means that we can now predict how vulnerable mussels are at different sites in the Wadden Sea just by knowing how deep the water is at those sites (Figure 13a, b).
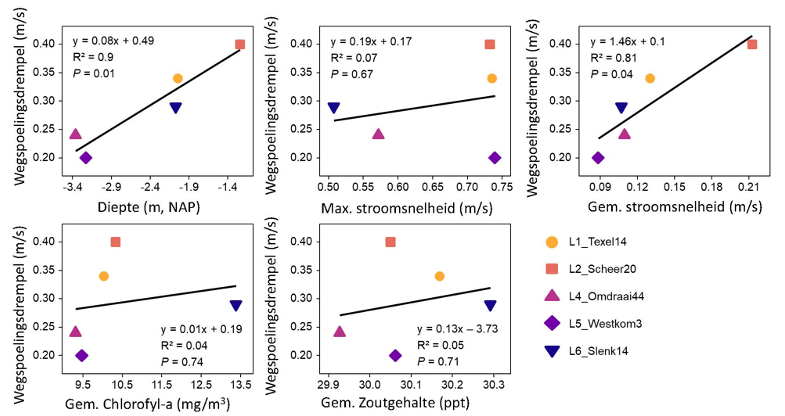
Fig. 4Correlation between site-specific critical threshold for runoff (CDT) and local environmental factors.
To assess the stability of underwater mussel beds in the Wadden Sea, we used a simple wave model. This model uses information about water depth and wind conditions to calculate the movement of water and forces on the bottom. Using this model, we calculated the force on the bottom caused by waves, the so-called “bottom shear stress. We calculated the daily maximum bottom shear stress over the past 11 years (2011-2021) and compared it to the critical threshold value (CDT) for mussel detachment. If the calculated force on the bottom exceeded the CDT, it meant a high risk of washout of mussels at that site.
To understand this risk, we looked at how often this happens over an extended period of time. We call this the “return interval. A short return interval means a higher risk of runoff, while a longer return interval indicates a lower risk. We carried out these calculations for all subtidal areas in the Dutch Wadden Sea where mussels (may) occur, creating a map showing the risk of washout.
Our conclusions are based on the relationship between runoff risk, water depth and CDT.
Mussel beds located in shallower parts of the sea tend to have a higher CDT, because they are more often exposed to higher bottom forces and therefore have become more retentive see also here. This means they are less likely to be washed away (Figure 5d).
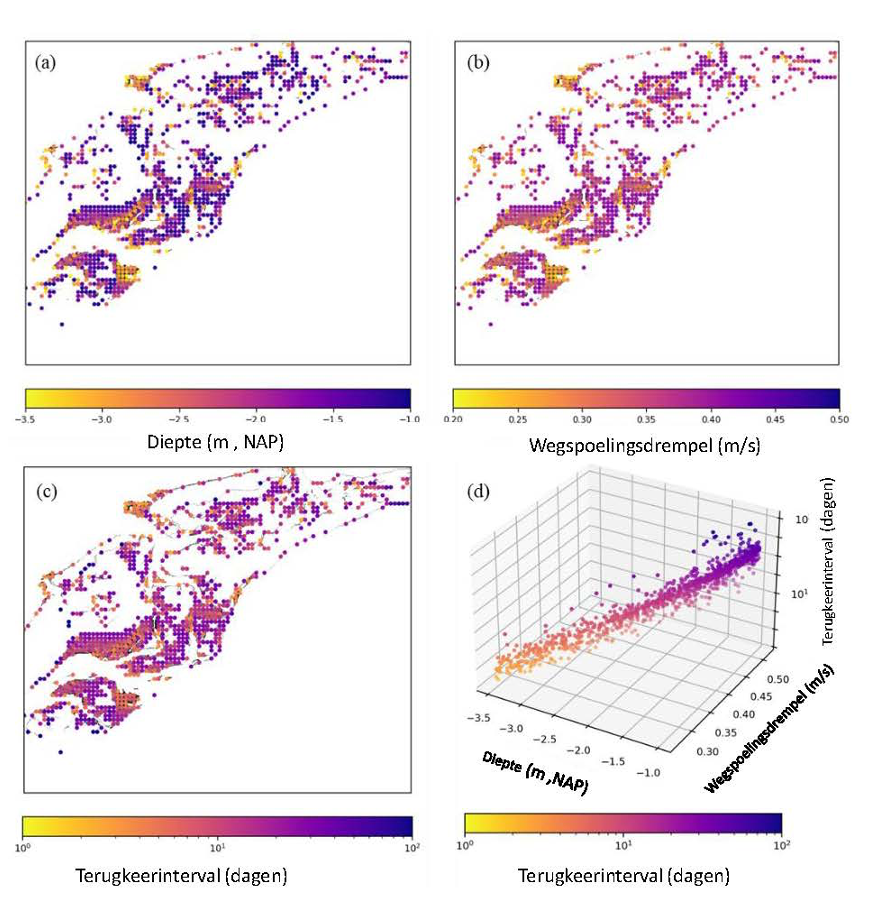
Fig. 5(a) Water depth map of areas with subtidal mussel occurrences in the Wadden Sea. (b) Critical threshold values (CDT) for washout of subtidal mussel beds in the Wadden Sea calculated from the water depth map. (c) Map of washout risk for subtidal mussel beds in the Wadden Sea. A shorter time between CDTs indicates a higher risk of washout. (d) Relationship between the risk of washout of mussels, water depth and CDT.
Finally, we compared the resulting map of runoff risk with data on mussel survival in plots. These are documented in a scientific study (DOI: 10.1016/j.seares.2016.02.001). This study recorded loss rates of populations in 51 mussel farming plots in the Wadden Sea. The results showed strong agreement between the results of our risk assessment and the field survey results (Figure 6), reinforcing confidence in our map of runoff risk.

Fig. 6 Relationship between risk of washout (i.e., return interval) of mussel beds as obtained in this study and loss rates of populations of mussel beds as documented in the literature.
Briefly, this study describes the influence of waves and currents on mussel stability. This is based on field measurements and this knowledge has been applied for risk assessments in the Wadden Sea. We saw that mussel beds in shallower areas are relatively more resilient than those in deeper areas, exposure is also higher there because waves have more effect on the bottom. This indicates that mussels are more resilient in shallow areas under normal conditions, but may be less stable under extreme conditions. Using site-specific thresholds, based primarily on depth rather than general thresholds, greatly improves the accuracy of our risk assessments.
The above is a summary of: Zhiyuan Zhao, Jaco C. de Smit, Jacob J. Capelle, Tim Grandjean, Mingxuan Wu, Theo Gerkema, Johan van de Koppel, Tjeerd J. Bouma, Antecedent conditions shape subtidal mussel bed stability under high-energy hydrodynamic events (in preparation for publication).