
Mussel beds respond to storms in two ways: how well they can weather the storm and how quickly they recover after the storm is over. If clams return to normal quickly after a storm, they can limit the damage from the storm. But if the effects of the storm last long, it becomes more difficult for mussels to recover. Over the past 12 years, the Royal Netherlands Meteorological Institute (KNMI) has recorded 32 severe storms in the Netherlands that caused severe weather alarms. It is notable that of these 32 storms, 8 were within 3 days of another severe storm. Since we expect more storms in the future, it is important to understand how repeated storms affect the ability of mussel beds or of mussels in mussel culture plots to recover.
In this study, we conducted an experiment in aquaria to understand how repeated storm events affect the recovery of mussel beds. We did this by mimicking wave effects (see Figure 15). In this experiment, we first created mussel patches in a 0.56 by 0.65 meter container with a certain amount of mussels per square meter. We then mimicked storm disturbances by taking mussels apart by hand twice a week. We conducted several experiments with different soil types (hard/soft) and different conditions (sheltered from waves/exposed to waves). For two weeks, we recorded the mussels’ recovery process using time-lapse cameras. By automatically identifying mussels in photographs using image processing techniques, we measured changes in mussel cover. This gave us a detailed picture of how quickly mussels reassemble after disturbances caused by storms, which we call the “recovery rate.”

Fig. 1 Photograph of aquariums designed to mimic wave effects. Right: Classification of the perturbation-restoration experiment.
Initially, the mussel-covered area on soft bottoms (sand/silt) was less than on hard bottoms, suggesting that mussels on soft bottoms tend to stick together more (see Figure 16). On hard substrates (sand/shells), mussels attach more to the substrate than to each other. For mussels on hard substrates, we saw no significant difference in how they behaved after disturbance (see Figure 16). Mussels on the soft bottom without waves remained almost the same after disturbance, but when exposed to waves, the mussel cover on the soft bottom increased, meaning they tended to stick together less, especially after the 3rd and 4th disturbance (see Figure 16). This suggests that mussels tire and become less good at staying together after repeated disturbances caused by storms, and waves amplify this effect.

Fig. 2 Effect of repeated storm conditions on mussel cover (Hard subst. = hard substrate, Soft subst. = soft substrate, Hard subst.+ waves = hard substrate with waves, Soft subst.+ waves = soft substrate with waves)
After the interesting results of our first experiment, we decided to conduct a follow-up study with perturbations and recovery. This time we conducted the experiment in special wave trays (see Figure 17). These tanks mimic waves more realistically, which makes our experiments more realistic. Moreover, these bins are larger, which allows us to test different storm frequency variations and repeat the experiment multiple times for more precision.
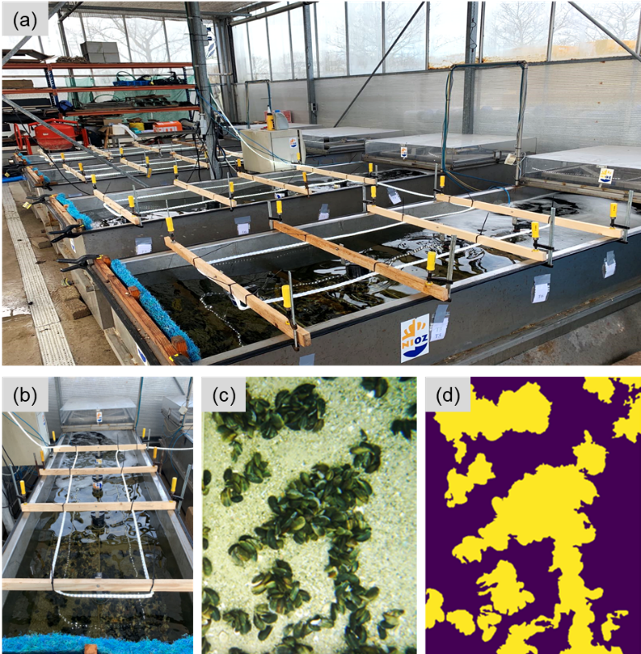
Fig. 3 (a) Photograph of the wave trays used for the perturbation recovery experiment. (b) Arrangement in a wave tank. (c) Photograph of mussels taken with a time-lapse camera during the recovery process. (d) Images obtained from quantitative photoanalysis, which can be used to calculate mussel cover and edge-to-surface ratio.
Based on what we learned in the previous experiment, we focused on soft surfaces in this round of research. However, we used a larger amount of mussels per square meter (10 kg/m2) and we introduced different frequencies of storm disturbances (see Figure 4):
- T1) Disruption from a storm occurred once a week.
- T2) Storm disruption occurred twice a week at regular intervals.
- T3) Storm disruption occurred twice a week, continuously.
- T4) Storm disruption occurred four times a week at regular intervals.
- T5) Storm disruption occurred four times a week, continuously.
- T6) Storm disturbance occurred at irregular intervals, combining both once-weekly (T1) and twice-weekly (T2).
This allowed us to investigate a wider range of situations to better understand how mussels respond to different frequencies of storm disturbances in a soft substrate and exposed to waves.
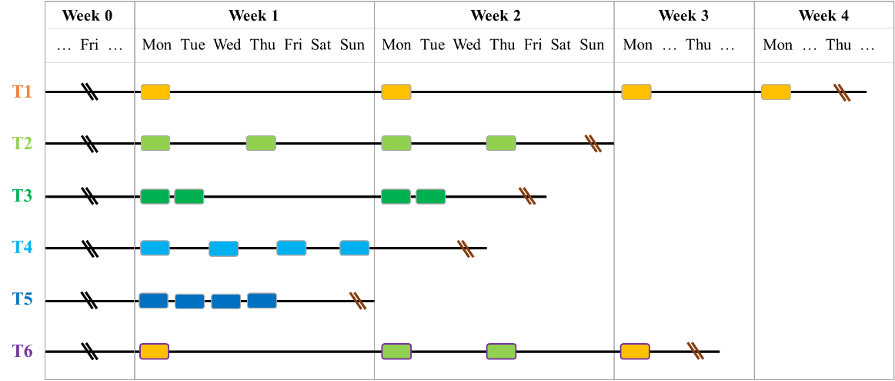
Fig. 4 Experimental treatments related to repeated storm events. The black double slash indicates the beginning of the treatment, and a brown double slash indicates the end of the treatment.
In each experiment, we simulated a storm-related disturbance by pulling mussels apart by hand and scattering them randomly across the surface so that they would not be lost but released. We used timelapse cameras to track the way the mussels come back together after each disturbance. We measured both the rate at which they rejoin and the final pattern of mussel growth (see Figure 17). The rate of gathering of mussels can be seen as a measure of recovery, while the final pattern tells us something about how well mussels cope with disturbances. We measured this at high frequency, say every 20 minutes, by automatically recognizing mussels in photographs using advanced image analysis. This gives us a detailed picture of how quickly mussels recover after disturbances caused by storms.
To compare different datasets, we converted the data from absolute values to ratios. The rate of aggregation was then determined by looking at the slope of the line showing the relative change in mussel cover within two days of each storm disturbance. The results showed that regardless of how often the storm occurred, the rate at which mussels reassembled became slower as the number of storm events increased (see Figure 5). Although the degree of delay varied somewhat, it was noteworthy that, in all treatments with different storm frequencies, the rate at which mussels reassembled after the first storm disturbance was consistently significantly lower than that after the fourth storm disturbance (see subplots in Figure 5).
Similarly, we examined how the ratio of edge to surface areas of mussel sites changes during recovery after each storm. We did this by dividing each measured value by the initial value we set at the beginning.

Fig. 5 Change in mussel abundance after repeated storms (4 times) at different frequencies of storms. We used the slope of a straight line for this purpose to indicate how quickly the mussels rejoin each other during recovery after a storm. The graphs show what, on average, this regrouping rate of mussels looks like after each storm. The asterisks are used to indicate when the values are really different from each other.
We found that as more storms occurred, regardless of how often they occurred, the rate of mussel pattern change (how the edge and surface of mussel beds relate to each other) becomes slower during recovery. This is shown in Figure 20.
Nevertheless, the complexity of the pattern, or how the edge and surface of the mussel beds relate to each other, seems to eventually become about the same after each storm. This is true if we look at what happens two days after the storm passes, as shown in Figure 20.
A striking point is that the complexity of the mussel pattern is always significantly lower than immediately after the first storm (this can be seen in the small graphs in Figure 20). However, there is one exception, namely in Treatment 3. In that treatment, the storms occurred twice in quick succession, within one week. This meant that after the first and third storms, mussels had only one day to reassemble, making the pattern of mussels less complex.
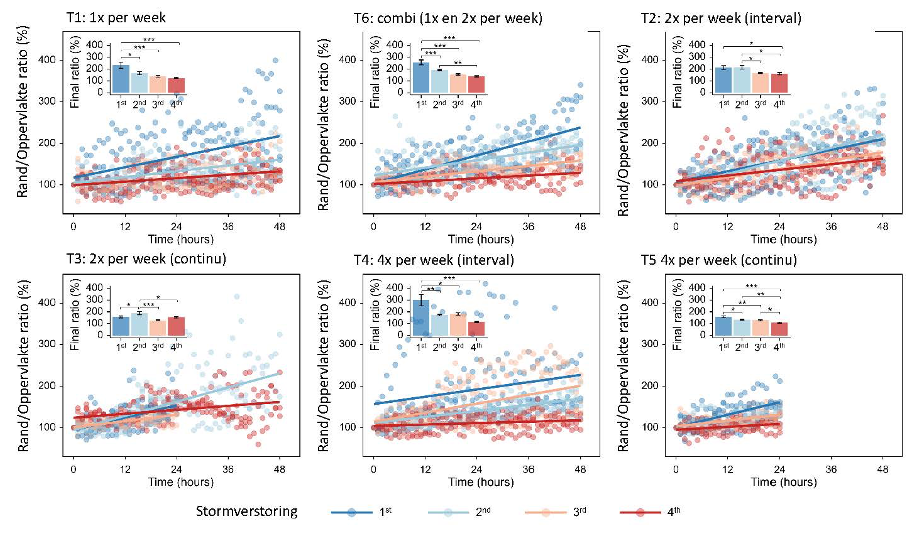
Fig. 6 Changes in the relative ratio of edge to surface area of mussel patches after repeated storm disturbances (n=4) at different frequencies of storms. In this figure, the edge area ratio is used to indicate the complexity in the aggregation of mussels during recovery. The graphs show how complex the pattern of mussels eventually becomes (that is, the final ratio) after each storm disturbance. The asterisks are used to indicate when the values are really different from each other.
To understand how different frequencies of storms affect mussel recovery, we looked at how quickly mussels recovered after each storm. We investigated this for different storm frequencies (Figure 7). It was striking that when storms became more frequent, mussels seemed to adapt and recover faster. We also looked at the complexity of the mussels’ pattern. We wanted to know if this pattern changed because of the storms. But we found that the number of storms influenced this pattern more than the frequency of storms. So how often there were storms appeared to be more important than how severe they were to changes in mussel patterns.

Fig. 7(a) shows how much the rate at which mussels recover (how quickly they reassemble) changes after four storms of different frequency. (b) shows how complicated the patterns of mussel patches on the edges are after four storms of different frequency.
This study shows that when we expect more and more frequent storms, mussels in certain places do not recover as well. It depends on the type of substrate, environmental conditions and how many mussels there are. In places where there are waves and the ground is soft, mussels seem to get “tired” from the increase in storms. This leads to slower and slower recovery rates and simpler patterns of where the mussels are located.
But the interesting thing is that the frequency of storms also plays a role here. If the same amount of storms become more frequent, the mussels seem to adapt to the increased stress. It’s a bit like the saying “what doesn’t kill me makes me stronger.” As a result, they recover better from repeated storms.
The above is a summary of: Zhao et al. Impact of repeated storm events on the recovery potential of mussel beds, (in preparation for publication)