
Currently, we usually measure the threshold at which mussels are released by hydrodynamic forces in the laboratory, for example, with stream channels. But we do not yet have a practical tool that mussel farmers can use on site to measure mussel bed stability. Our goal was to develop such a tool.
The ideal design would be a small framework that mussel farmers could use from their vessels. This framework has a mechanism to move mussels sideways so that we can measure the forces they can withstand. While this sounds promising, we were not sure if we could obtain useful data from it. Therefore, we first created a prototype (see Figure 22) and conducted tests with small mussel beds.

Fig.1(a) Conceptual design of the RAMS tool. (b) Photograph of the RAMS tool prototype.
After initial testing, it was found that the original net did not work well because it was difficult to drag the mussel beds due to poor attachment to the surface. So we decided to vary the weight of the net and added fishing leads in different ways:
- We attached three lines to the back of the net (additional weight = 345 g) (Figure 23a).
- We placed a ring of lead around the perimeter of the net (additional weight = 950 g) (Figure 23b).
- We distributed three lines of lead along the length of the net (additional weight = 950 g) (Figure 23c).
Adding weight to the net, however, brought a challenge. Too little weight would reduce mussel catch capacity, while too much weight would flatten the mussels and again reduce catch capacity. So we came up with a new design that used wooden beams that could be placed behind the clam beds. This new design proved to be more effective in successfully dragging the mussels.

Fig. 2 Three different configurations of weights used to weight the net: (a) at the back of the net; (b) in a ring around the perimeter of the net; and (c) in three lines along the length of the net. (d) Shows the frame with wooden beams placed at the back.
During testing, we placed prepared clamshells in the test section of the RAMS tool while the pneumatic piston was fully extended (in the starting position). As the piston retreated to the final position, the net or beams were pulled across the sediment surface to capture the clams. We kept the RAMS tool constantly driven by the same air pressure, so it was like the beams were always moving at a consistent speed. We used two cameras: one to capture the test area and the other to record the display of the digital force meter. These videos were edited in CapCut, capturing measurements from the digital force meter every 0.1 second.
We performed the same tests on clumps of clams with different numbers of clams (20, 30, 40 and 50), taking 10 repeated measurements for each size. The results showed that we could effectively measure the force required to loosen the clams using the RAMS tool. This force was calculated as the difference between the force required to move both the frame and the clams and the force required only to move the frame (Figure 24). It was striking that there was a clear trend of increasing force required to loosen the clumps of clams as the size of the clumps increased (Figure 24).
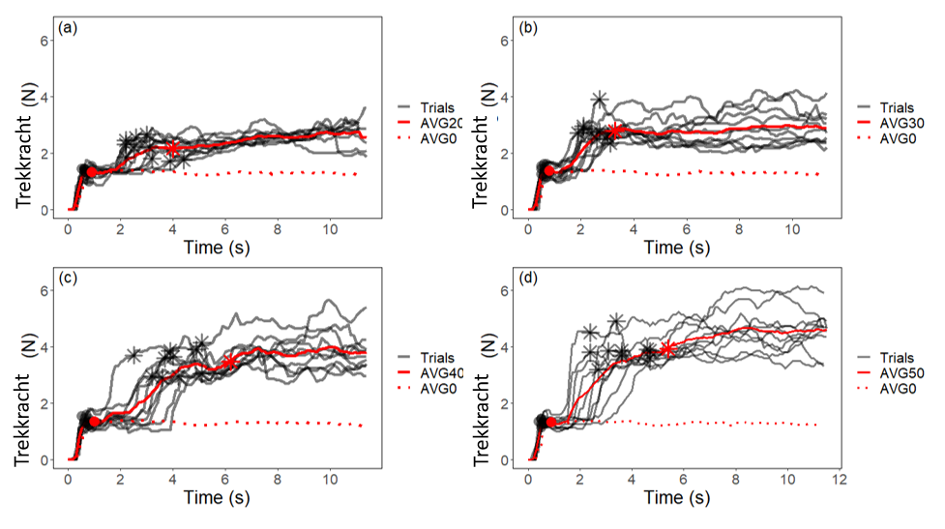
Fig.3 Drag force, measured using the RAMS tool, required to release clams of different sizes. Dots and asterisks indicate the time when: (1) the frame moved smoothly and (2) all mussels in the test were released. “Trials” refers to repeated tests with a given spot size. AVG0, AVG20, AVG30, AVG40 and AVG50 represent the mean results of the tests with n = 0, 20, 30, 40 and 50 mussels, respectively.
To verify that our measurements with the RAMS tool were correct, we looked at how much force was needed to loosen clams of different sizes. We did this in the stream channel at NIOZ. We conducted 52 tests making spots with different numbers of mussels, ranging from 1 to 60 mussels. During the tests in the stream channel, we kept the flow rate of the water constant, but slowly increased the height of the waves from 2 cm to 8 cm, in increments of 2 cm. This created different strengths of flow on the bottom. Each wave height we held for 10 minutes, and we stopped the tests once all the clams had come loose.
From the results of these tests, we were able to derive a simple rule: the larger the spot of mussels, the more force was needed to loosen them. We have depicted this relationship in a graph (see Figure 25). Using this graph, we could calculate how much force was needed to loosen mussel patches of different sizes. In this way, we could verify that the measurements we had made with the RAMS tool were reliable.
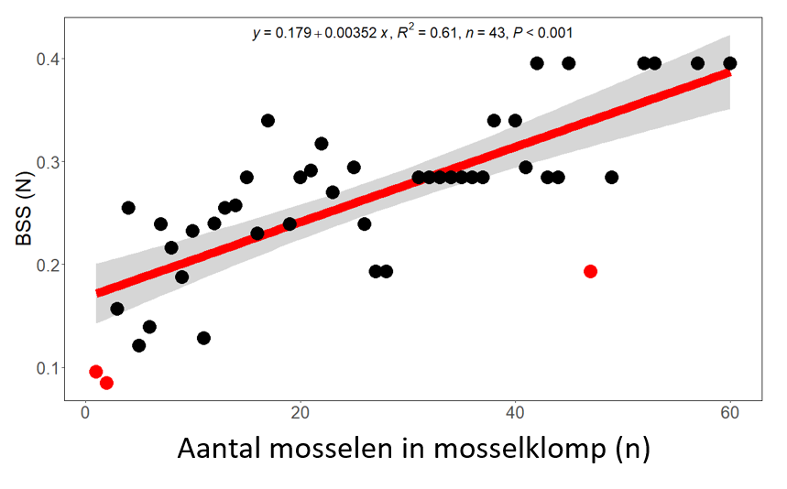
Fig. 5 shows how much bottom shear stress (BSS) was required to release clumps of mussels of different sizes, measured using the NIOZ current flume. Gray dots indicate outliers (Cook’s D > 4/n) and were not included in the linear regression model.
There were significant differences between the measurements we made with the RAMS tool and those made with the flume (see Figure 5). At a spot with 20 mussels, the force measured with the RAMS tool was three times higher than the flow measured in the stream channel. But most striking was that at a spot with 50 mussels, the measurements of the two tools differed by nearly eight times (see Figure 5).
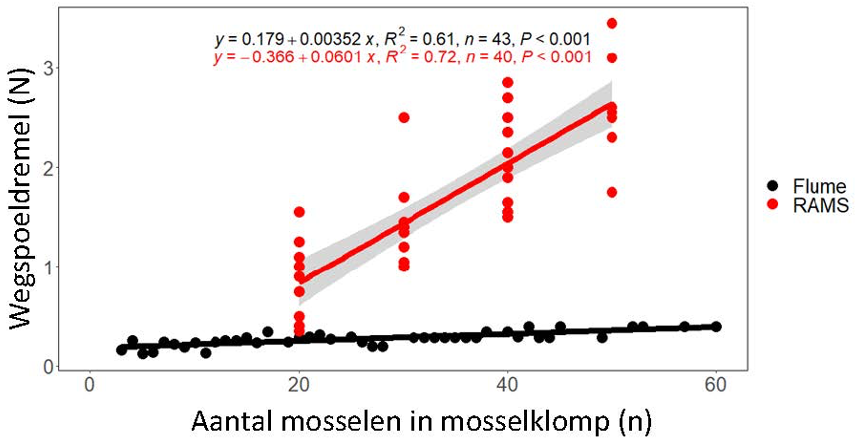
Fig. 5 Comparison between measurements with the RAMS tool and the NIOZ flume.
In short, we found that the RAMS tool is not accurate enough to measure the force required to loosen clams. This is mainly because it is less accurate compared to established measuring instruments such as the flow chute. The major difference between these two tools can be explained by the fact that the RAMS tool leaves the mussels firmly attached to the substrate and even sinks into the substrate during the dragging of the net or beam. This causes friction between the mussels and the substrate, increasing the force required to loosen them. Therefore, further efforts should focus on the development of portable tools that can realistically mimic hydrodynamic processes, rather than just disturbances caused by hydrodynamic forces.
Zhiyuan Zhao (NIOZ, 2023)